In the application and desktop virtualization, nothing is more important than the user experience. Users will be less productive and the business will suffer in case users are delayed in getting access to their work, if they experience latency in critical applications, or if they are unable to use their desktops.
Citrix administrators must be able to monitor all the different aspects of Citrix user experience proactively to ensure a great end-user experience. They need to be able to see certain end-user problems as they are starting to happen. And when a user experience issue is detected, they must be able to quickly troubleshoot the issues to minimize downtime. For effective troubleshooting, Teqwave Citrix MP will help you with:
- Log-on process monitoring to identify users that have issues accessing their desktops or applications.
- Session and machine monitoring to identify users that are facing problems such as poor responsiveness.
- User activity reports that capture historical user and infrastructure activity and provide valuable information for troubleshooting user experience issues.
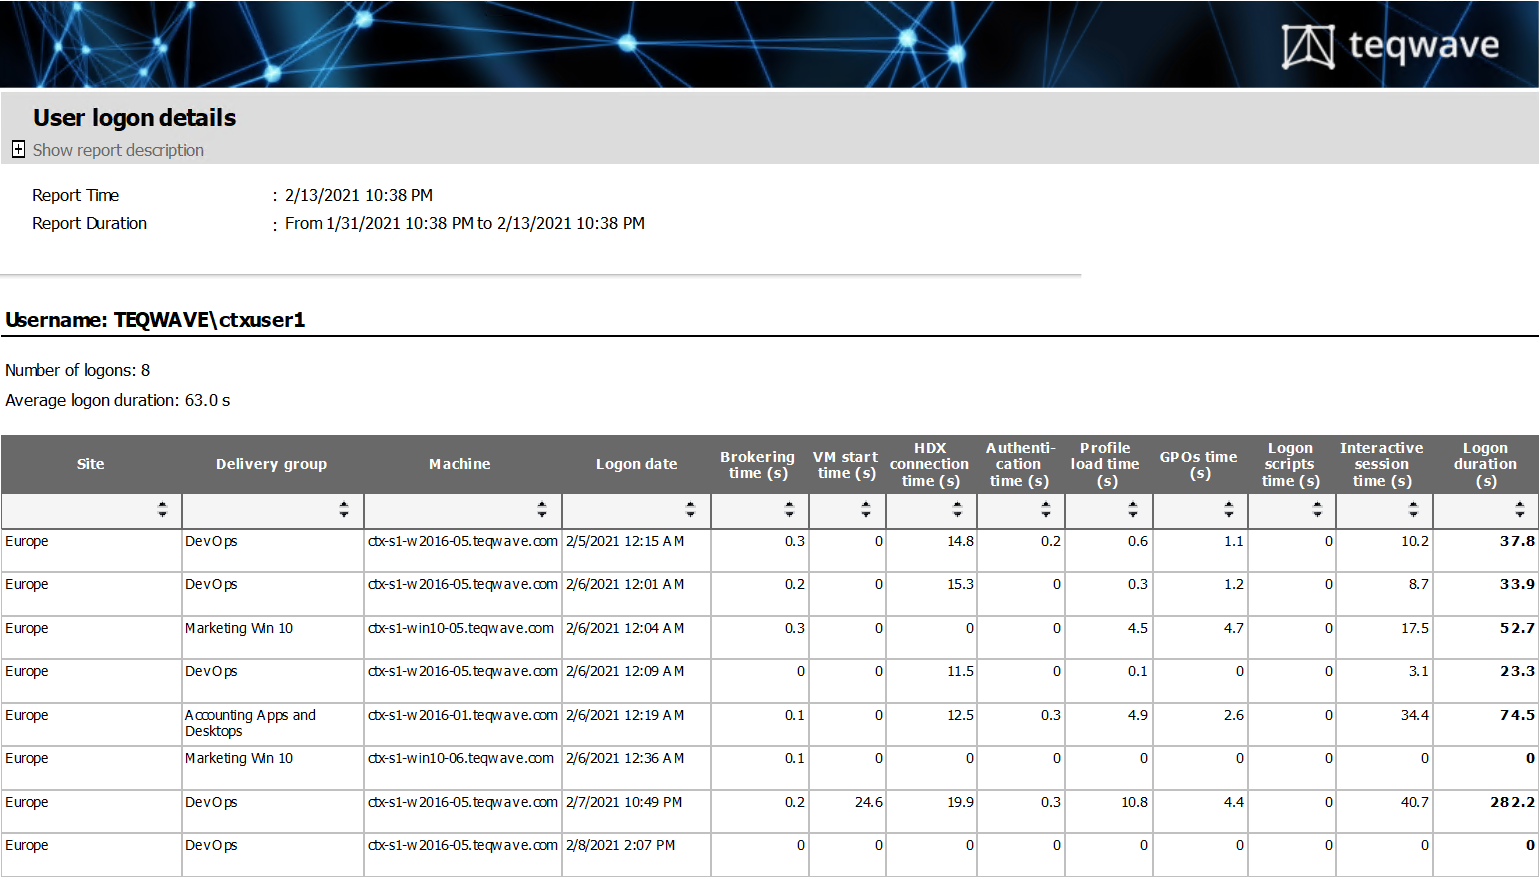
Log-on process monitoring helps you identify users that have issues accessing their desktops or applications, with the ability to drill down to individual log-on phases.
- Management Pack monitors in real-time the actual logon times of every user accessing the Citrix environment.
- In the alert message, administrators can see why logon is slow: whether it is being caused by GPO processing, logon script execution, profile loading, user authentication, or other factors.
- Logon alert also contains information about the endpoint device user was logging on from, the site, delivery group, and the target machine.

- Management pack saves user logon performance data and enables historical reporting and analytics through reports that provide valuable information for troubleshooting user experience issues. By default granular data is stored for 10 days and can be customized, however aggregated data can be stored for years, depending on your requirements.
Session and machine monitoring helps you identify users that are facing problems such as poor responsiveness, lack of the necessary compute or storage resources or overconsumption of network bandwidth.
- Management Pack monitors each individual end user session and detects users that are experiencing bad responsiveness due to high RTT or user sessions with high CPU usage.

- Citrix administrators frequently report that slow performance is caused by network connectivity issues between user terminals and the Citrix farm. Using Management Pack for Citrix, administrators can track
- SessionLatency – Network latency detected between the Citrix Receiver and the VDA machine (ms).
- SessionRTT – ICA Round Trip Time (ms). The time interval measured at the client between the first step (user action) and the last step (graphical response displayed).
For detailed list of collected information see the product documentation. Request a free trial now!
User activity reports capture historical user and infrastructure activity and provide valuable information for troubleshooting user experience issues, such as slow logons or bad application performance.
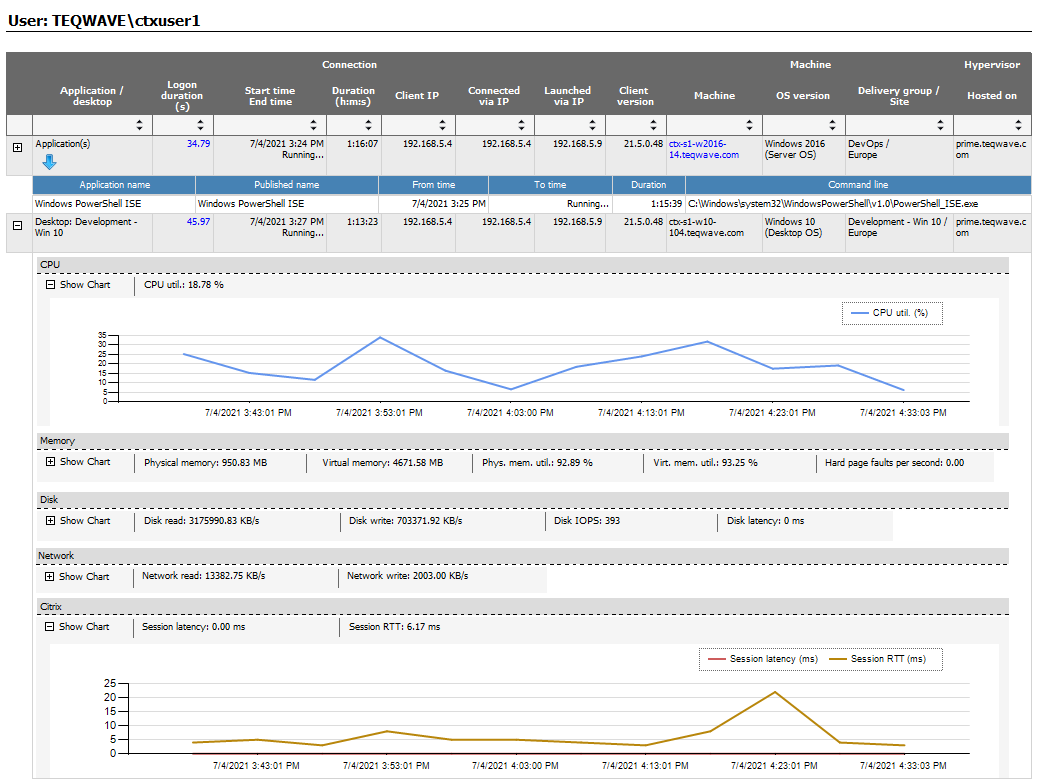
- Let’s say a user is complaining about issues when using applications or desktops that are delivered by the Citrix platform. A good starting point for troubleshooting is a “User Application and Desktop Activity” report that displays user session details including logon times, provisioning information, and applications/desktops used during the session.
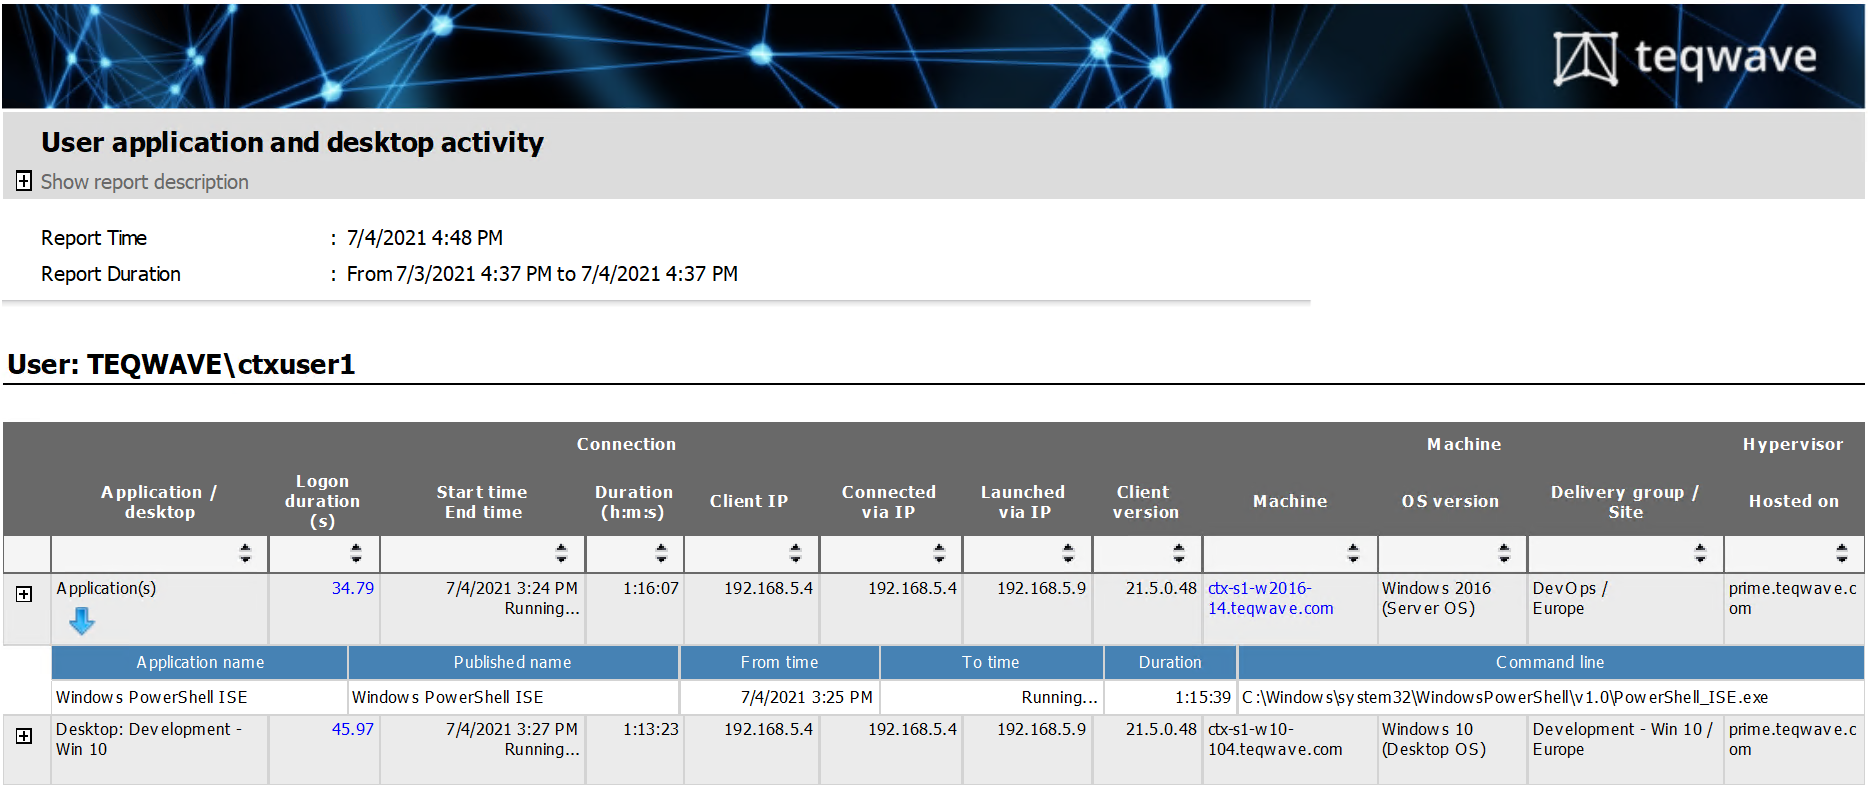
- By expanding a user session, administrators can get insight into session-specific details:
-
- Session CPU usage
- Session memory usage
- Session latency
- Session RTT
-
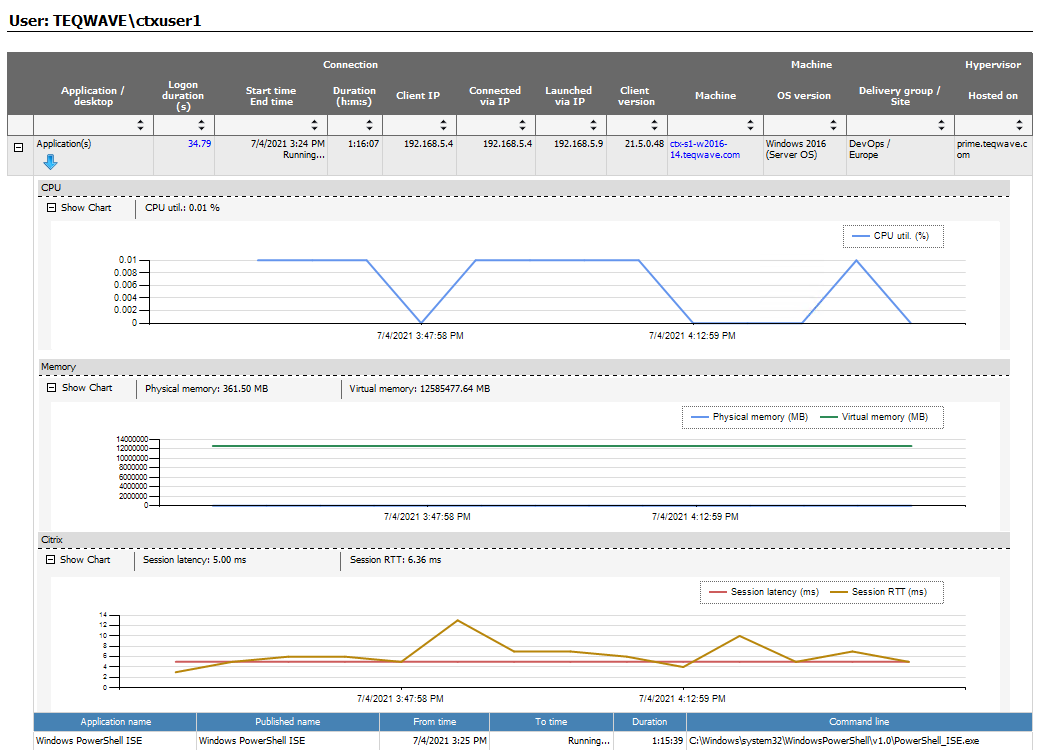
- The previous report will help you understand if there is an issue within the session, however, the reason for the bad user experience might be in the Server OS machine that is delivering this session.
- By clicking on a Machine link, a new report opens that displays Server OS performance details during the session duration.
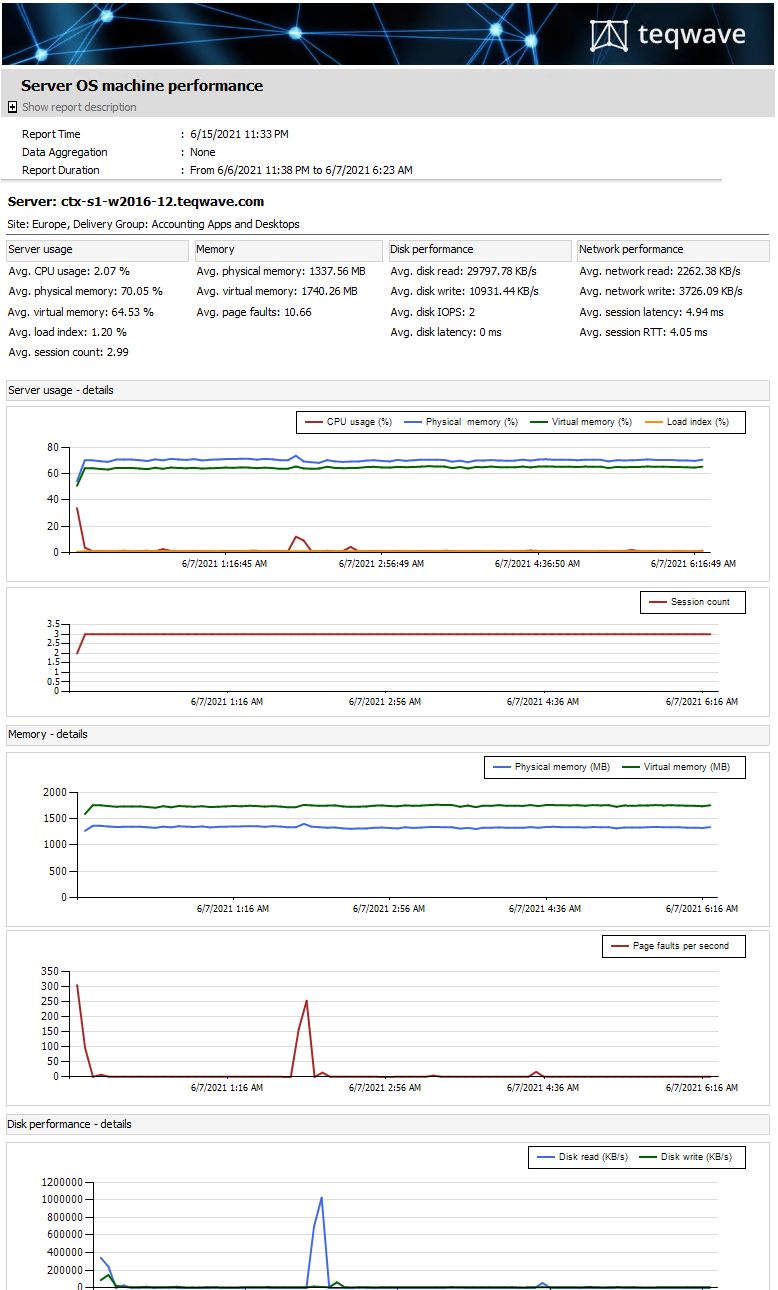
- For Desktop OS sessions, the report will show session details and OS performance details
